
After you go through your initial keyword research, you have a list of words you want to your site to be found for on Google. Ideally, if you were thorough in your research, you also have a list of longer phrases or questions people are using when they search on those words. But how do you know if your pages are ranking? How do you know if the improvements you’ve made to your posts and pages were successful? Are you ranking in the coveted top three spots of the search results, or are you trapped somewhere past page 2? In this post, we teach you how you can find the answers to those questions. And better yet – how you can use those answers to improve your content even more.
Estimated reading time: 7 minutes
Your content should answer questions!
If you want to create content that ranks, you need to focus your content on answering questions and solving problems that your customers have. to find those questions, you first need to think about the why behind their visit to Google. Let’s say they have a problem. Are they looking for information on how to fix that problem? Or do they want to purchase something that will fix it for them? Or is it possibly a combination of both of these, depending on the question they are asking?
When first creating your website, you have no choice but to take risks with your best educated guess here. But once you’ve created some content and optimized for certain keywords, you can use tools like Google Search Console to find out which search terms/questions are leading people to your website. You can see what pages people are landing on, and with Google Analytics, you can see how long they stick around.
How to check overall performance
Firstly, if you don’t already have Google Search Console set up, Yoast published a great guide to help you connect your site. Once you have Search Console connected, click the ‘Performance’ tab in the menu on the left-hand side. You should see a line graph that, by default, displays total clicks and total impressions over the last three months.
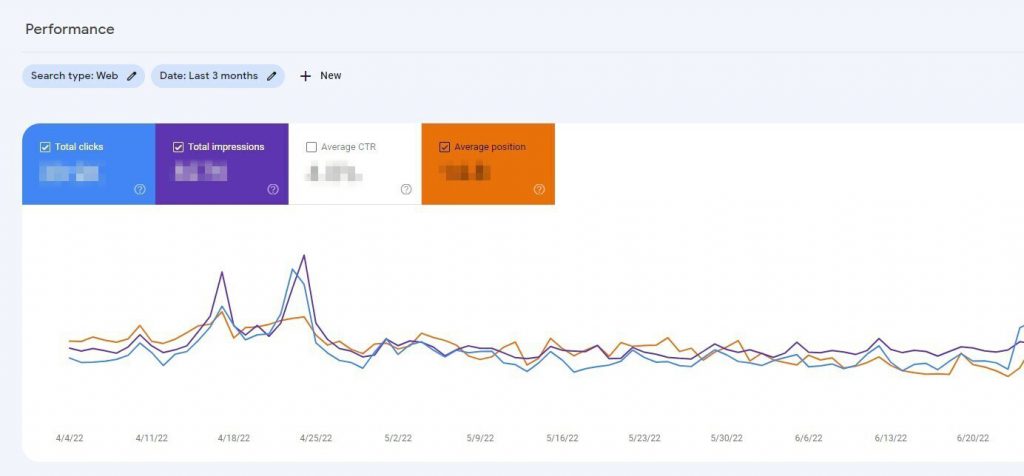
If you want to see your CTR (click-through rate) or average position trends over time, simply check the boxes next to them and they will appear in the graph. Additionally, if you want to see your performance over a different period of time, you can adjust the Date: filter along the top of the page.
Exploring your queries
Just below the graph, you should see a list of your top-performing queries. We recommend spending some time checking out the top 10 or 20 for your site. Are they the keywords you were expecting? Or are there some new ones in there you hadn’t anticipated?
By default, the list shows you the queries, the number of clicks each query got, and the number of impressions each receives in the search results, ordered by ‘most clicks’. By clicking on the column headings ‘Clicks’ and ‘Impressions’, you can change the order of the queries.
If you also want to see the click-through rate (CTR) or average position of each query, simply leave the boxes above the graph checked. We recommend doing this, because it provides so much more valuable information! If you aren’t sure what a certain piece of data means, simply click the question marks in the bottom right corner of the filter boxes.
Checking out a specific query or keyword
If you want to see how your site performs for a specific query (or a keyword), you can use the filter menu at near the top of the page. By clicking ‘+ New’, you can enter the query or queries you want to focus on. You can toggle the filter to only include queries containing a specific term, excluding a specific term, or exactly matching that term. By doing this a second time, you can compare the performance of two queries if you want to.
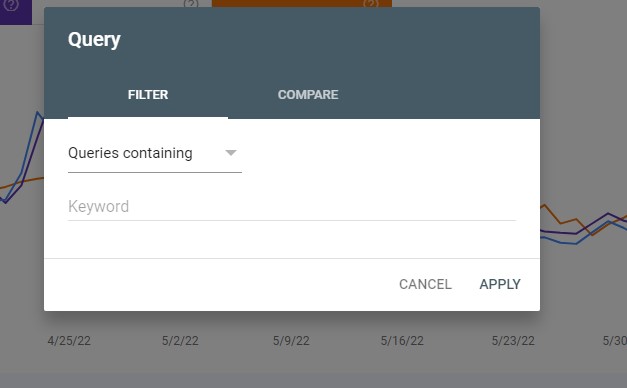
Another way to check a specific query is to click on that query in the list. After doing either of these things, the graph at the top of the page will adjust to only show data for the query you have selected.
Finding out which pages rank for a specific query
Once you have a query selected, you can then click on the Pages tab to see which page ranks with that particular query. There might be more than one page in that list. This may indicate what SEOs call keyword cannibalization – when multiple pages on your site are competing against each other for the top spot of the search results.
You might also notice that the page listed isn’t resulting in too many impressions or clicks. This could be an indication that your page doesn’t answer the question very well. Pages like this are great opportunities for improvement, so make a list of them!
Exploring your landing pages
Another great way to assess your site’s performance is to approach from the opposite direction – start with pages of interest on your site and see which queries Google is ranking those pages for. To do this, either click on the page from its place on the list on the Pages tab or enter that page as a filter manually. Then, you can check the Queries tab to see which queries match a particular page.
How to use this information to optimize your site
Now that you’ve gathered all of this data, how do you put it to good use? Generally, there are two options here: either improve the pages you already have to better fit your queries, or create new pages to answer the questions none of your current pages match up with.
Improving current pages
When users type in a query, they expect to find a particular type of content with that search. If their expectation doesn’t match reality, you could end up with poorly performing pages. You can spot these pages by looking at your average position data. If the page has existed for quite a while (9 months or longer), a high average position number typically means your visitors aren’t finding what they are looking for on your site. This sends a message to Google to put your page lower in the search results.
Note: Another equally plausible scenario could be that there is simply too much competition for that particular query or keyword. If you did your keyword research, you should know if this applies in your situation or not.
To fix these poor matches, take a look at who is ranking for those queries and the kind of content they created. Can you create something unique that has the same appeal to the needs of the customer? Give your visitors what they are looking for, and Google will reward you with higher rankings for those pages!
Creating new pages
Sometimes Google will send people to a page that doesn’t actually solve their problem or answer their question. If you notice queries showing up for your pages that don’t make sense, that is most likely why. Because Google doesn’t really have a good answer to that question yet.
If you see mismatched queries like that, use them as a great opportunity to create some new content. But before spending all that time and effort, make sure you conduct some research. If only a handful of people are searching for that query, it may not be worth creating a new landing page. So focus your efforts on the mismatched queries that have more traffic and are relevant to your business.
Get to work!
Analyzing your Google Search Console Performance report can open a lot of doors for content creation on your site. Now you know how to navigate the report and use the information you find to make your site even better. Happy optimizing!
Keep Reading: How To Optimize Your Google My Business Listing